ROCKWELL AUTOMATION (ROK)·Q1 2026 Earnings Summary
Rockwell Automation Beats on EPS by 11% as Industrial Recovery Gains Traction
February 5, 2026 · by Fintool AI Agent
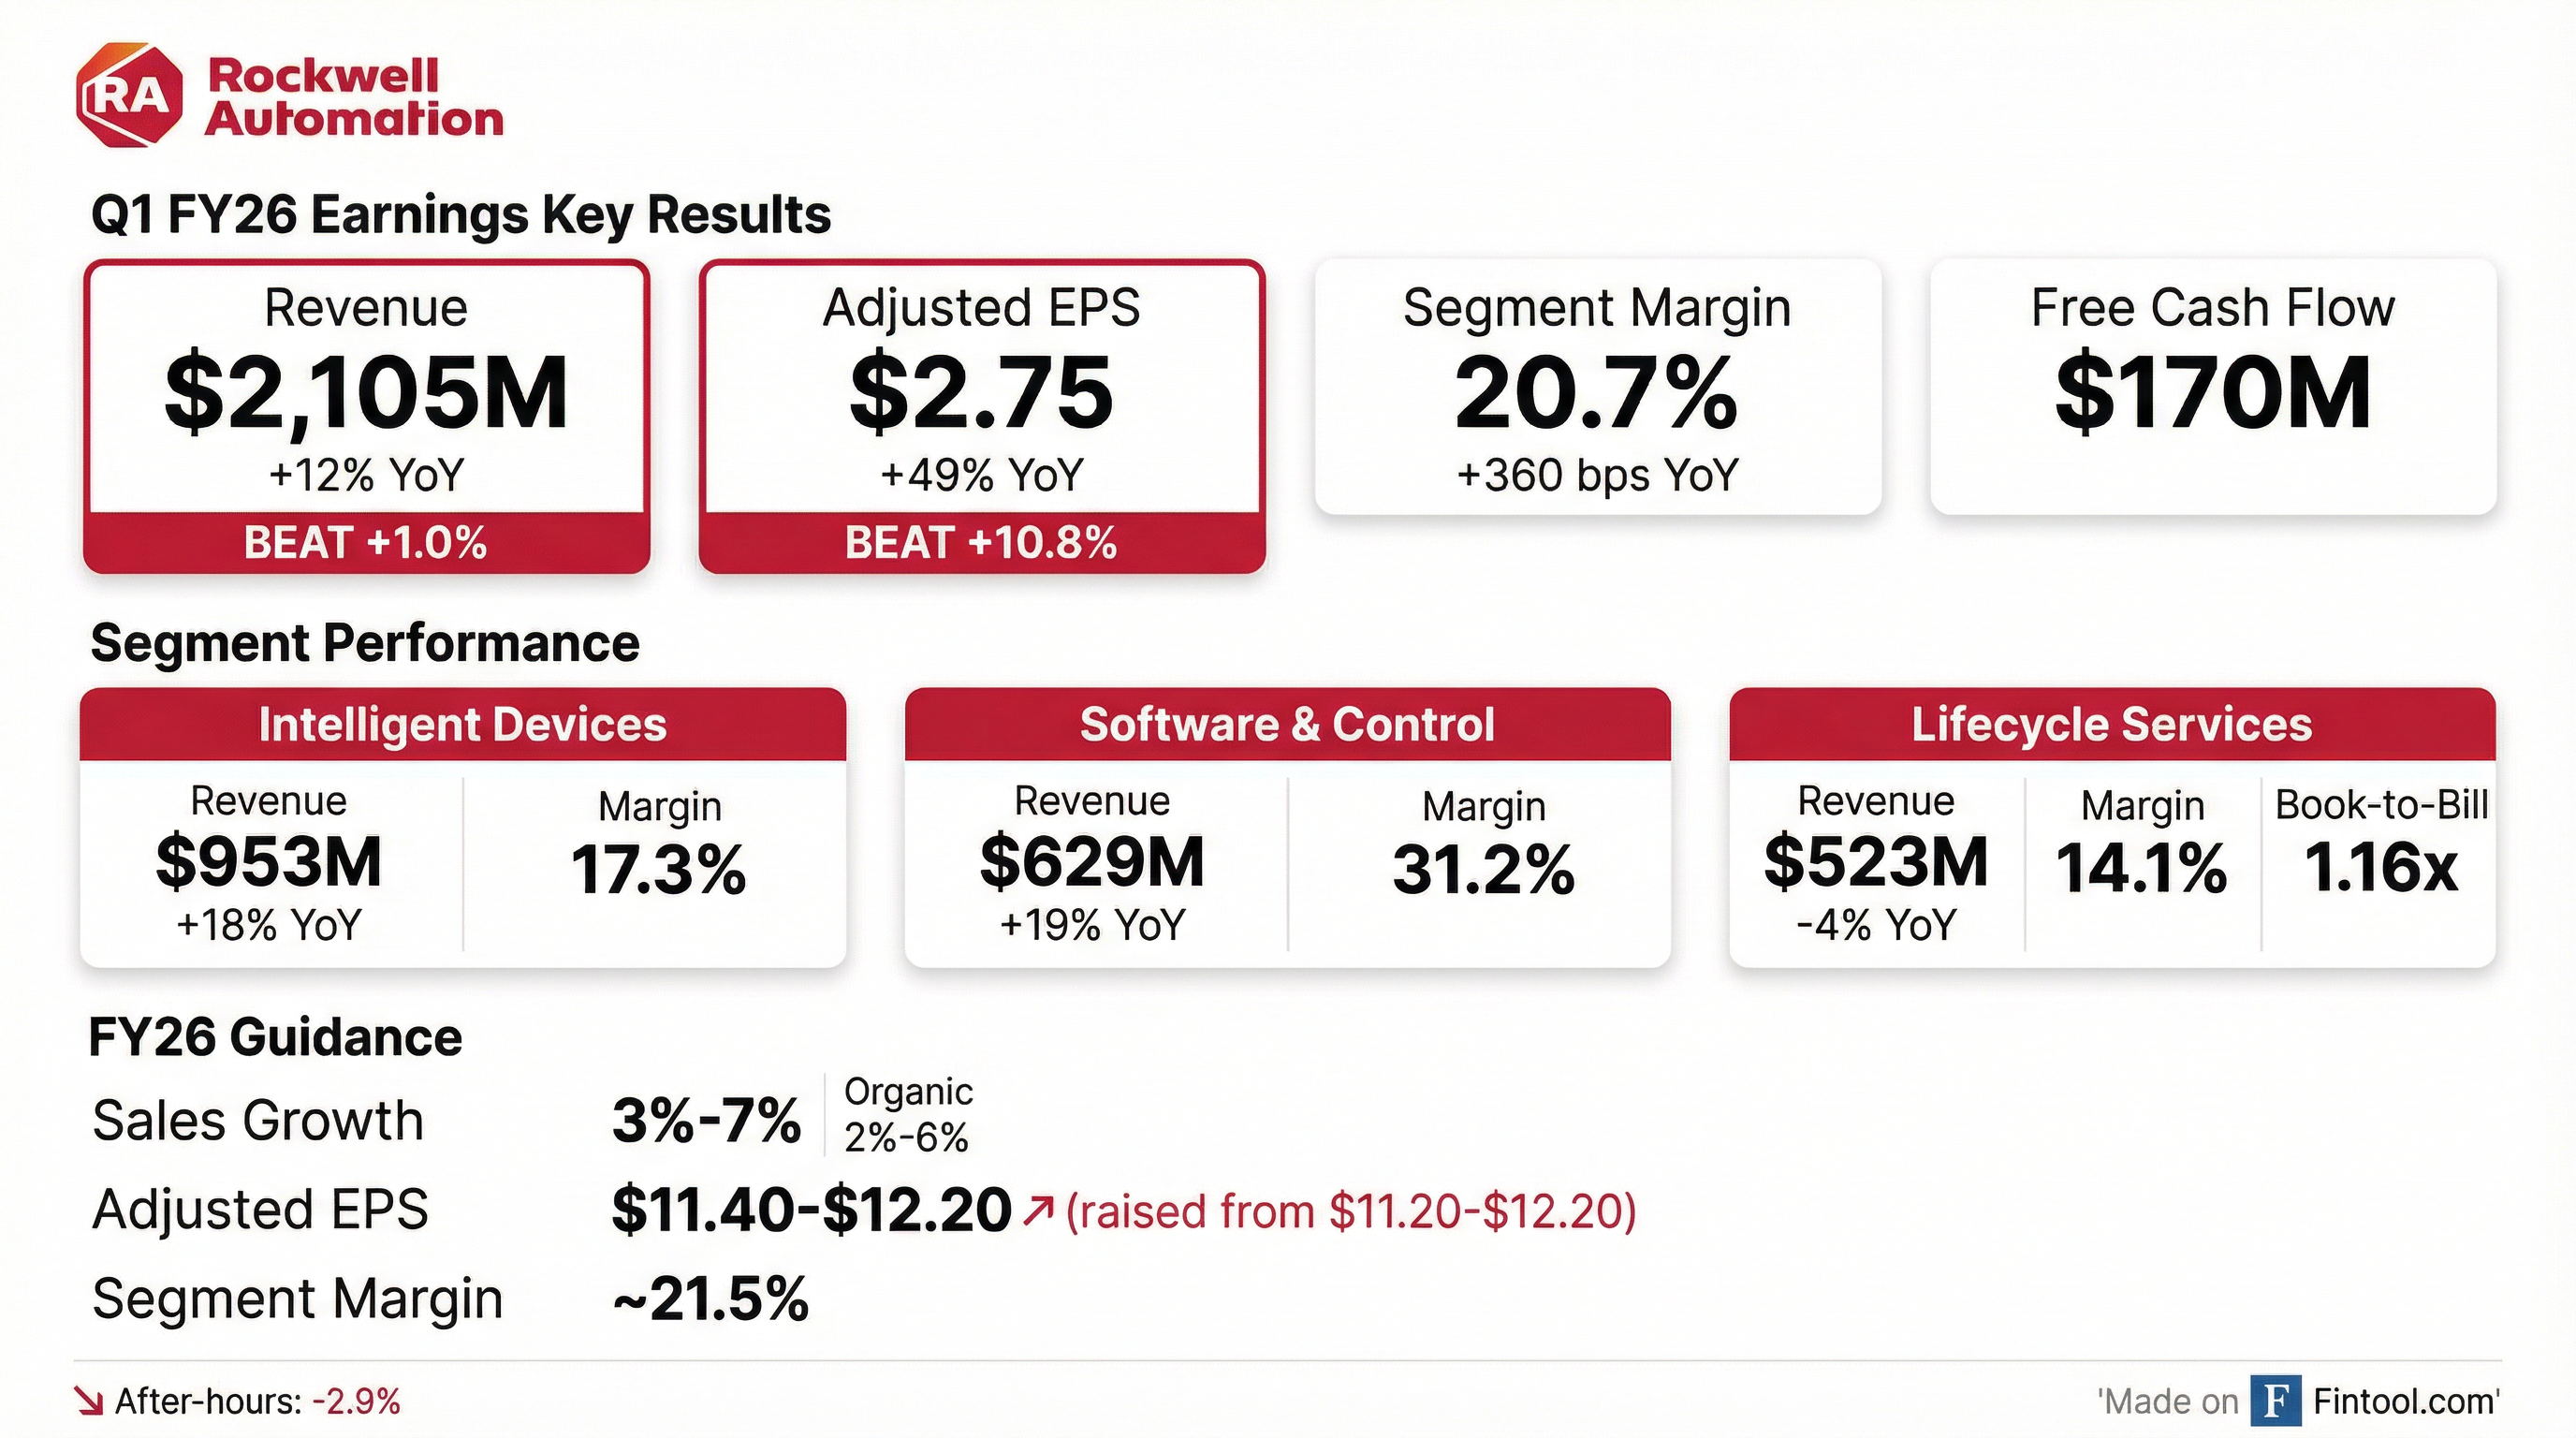
Rockwell Automation delivered a strong start to fiscal 2026, beating both revenue and EPS expectations with double-digit year-over-year growth across key metrics. Adjusted EPS of $2.75 crushed consensus of $2.48 by 10.8%, while revenue of $2.105B exceeded the $2.085B estimate by 1.0% . This marks the company's fourth consecutive EPS beat and extends a streak of improving operating margins that began in early FY25.
Despite the beat, shares traded down ~2.9% in after-hours to $417.86, suggesting the market may have expected more aggressive guidance or is concerned about the sustainability of the e-commerce surge.
Did Rockwell Automation Beat Earnings?
Yes — convincingly on EPS, modestly on revenue.
The EPS beat was driven by better-than-expected volume, favorable segment mix (Software & Control outperformed), and continued productivity gains . Management noted that tariffs "did not have a meaningful EPS impact in the quarter" .
Beat/Miss History (Last 8 Quarters):
*Values retrieved from S&P Global
What Drove the Quarter?
Segment Performance
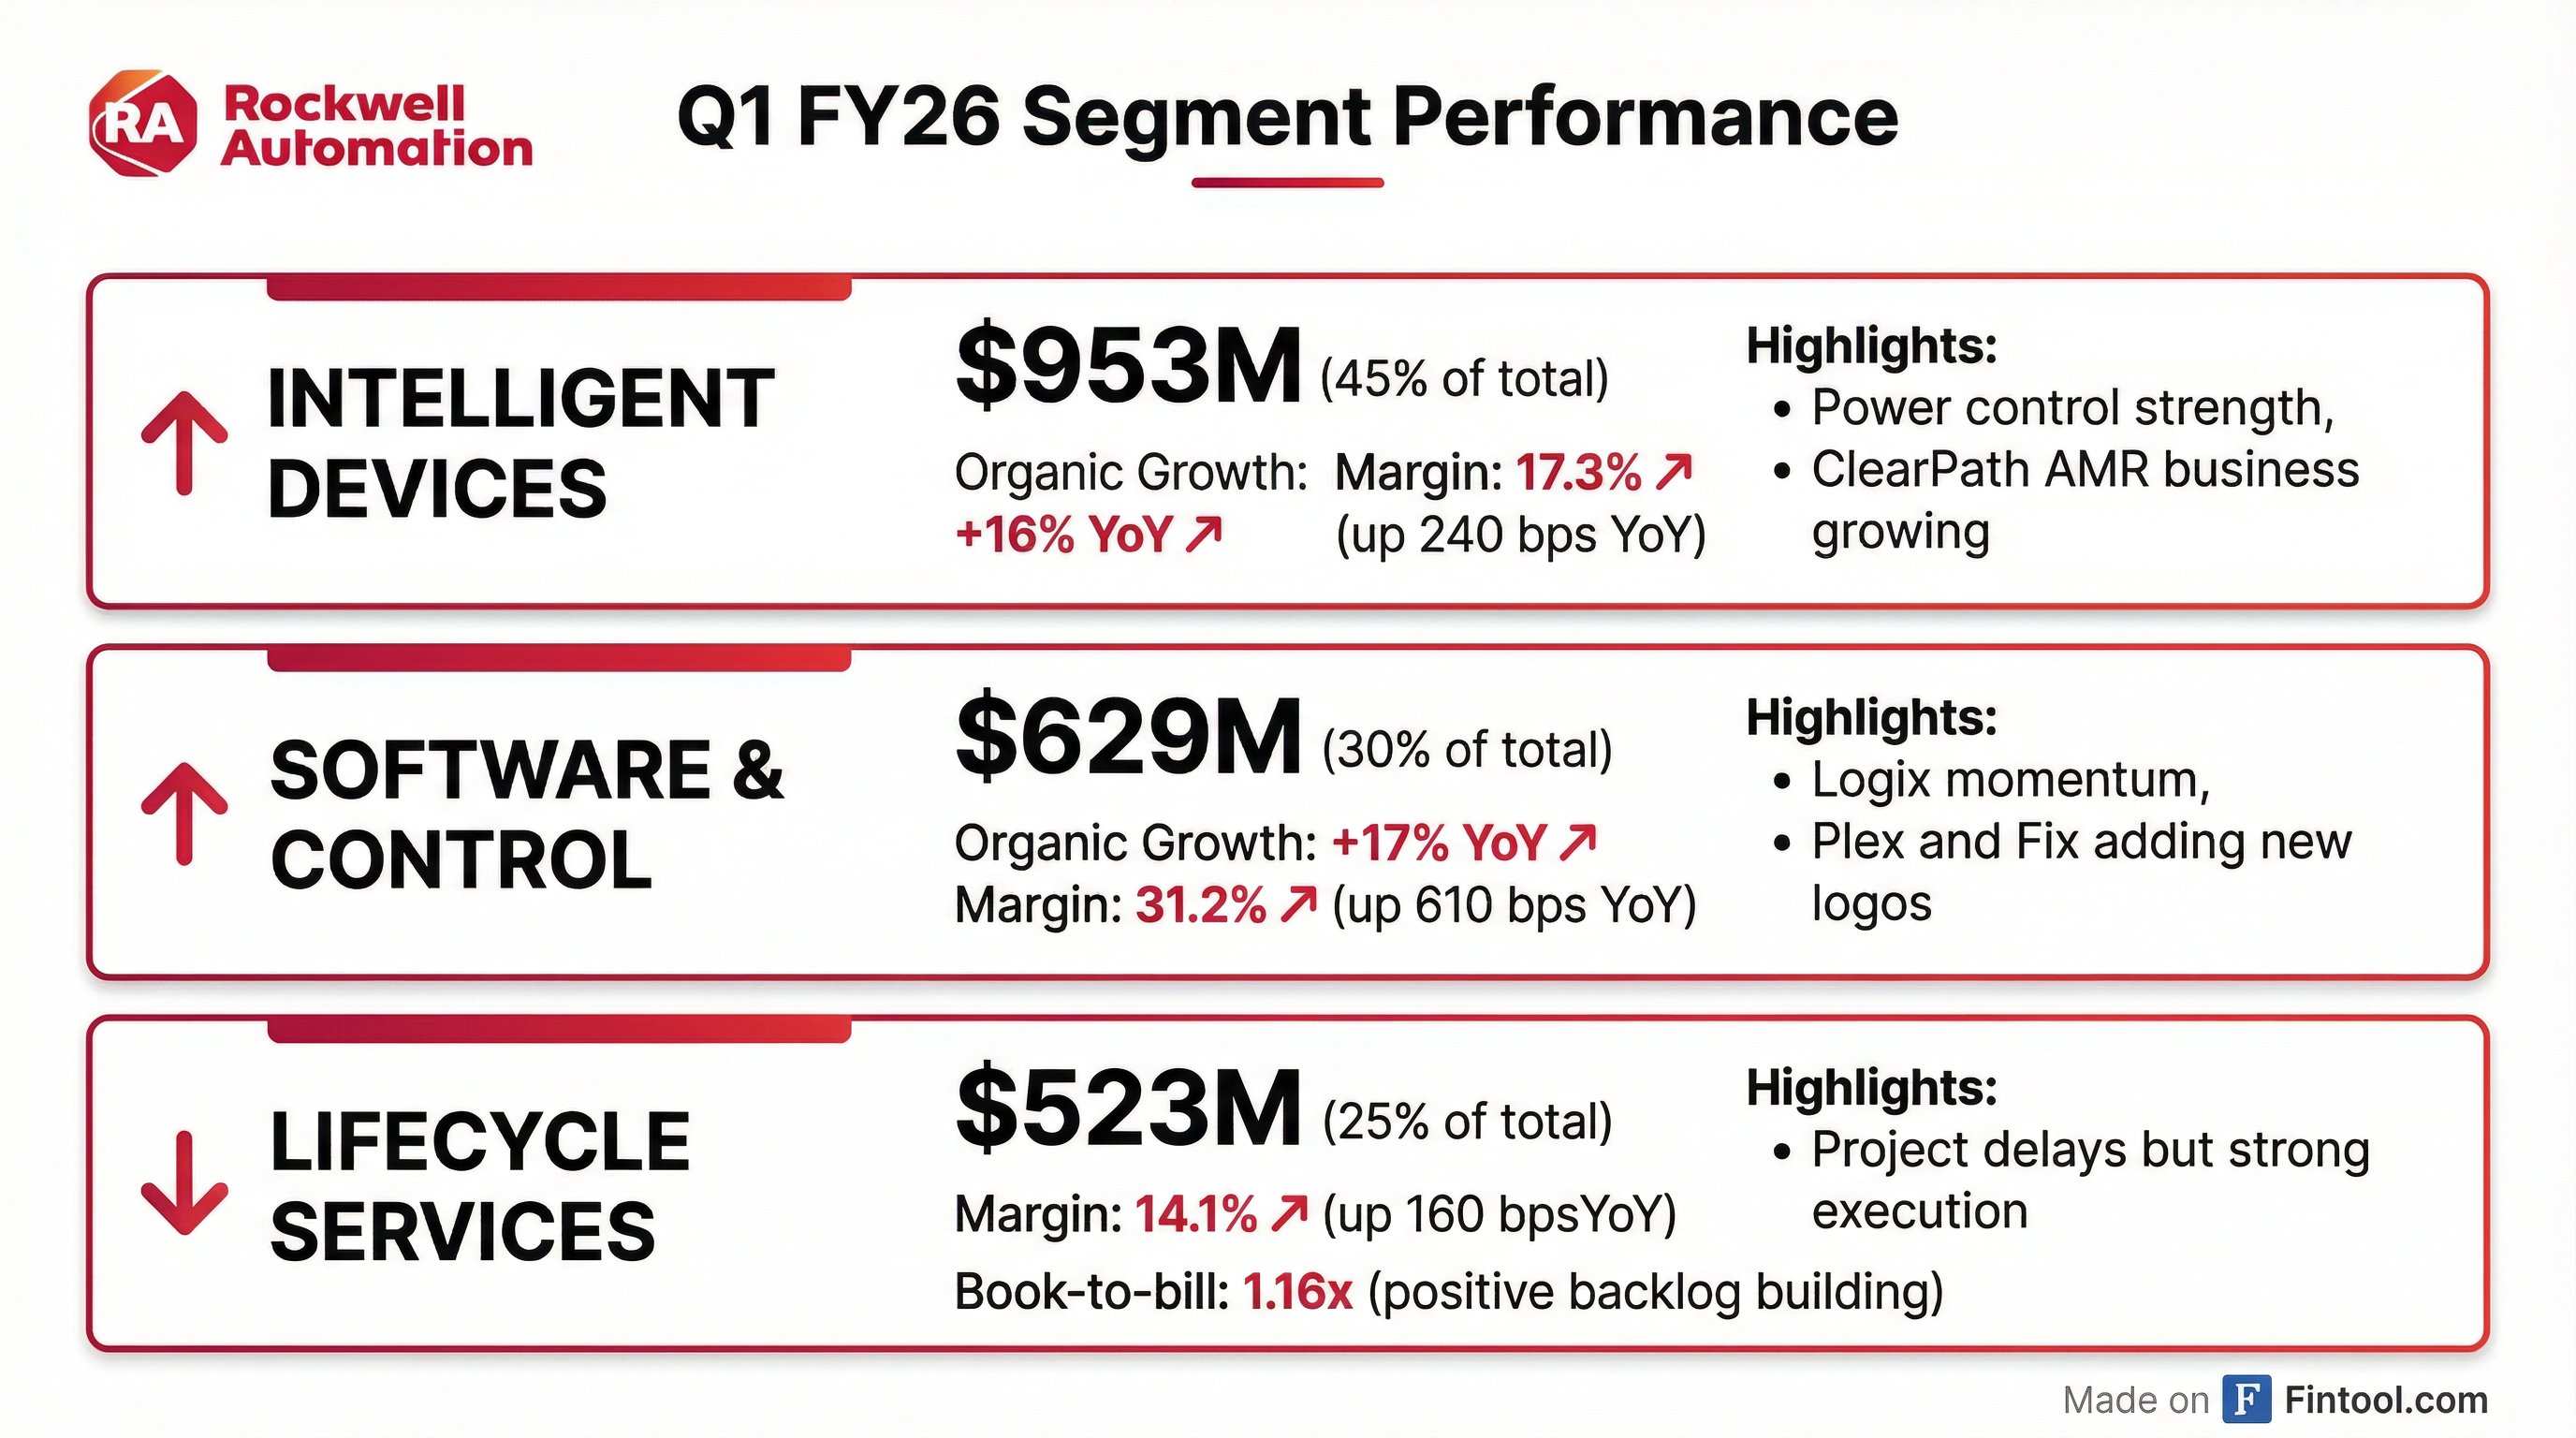
Software & Control was the clear winner with 31.2% segment margin — up 610 bps year-over-year — on continued Logix strength and software wins . The segment benefited from the new L9 processor launched ahead of schedule in FY25 .
Intelligent Devices grew 18% YoY with improving margins despite adverse currency mix. Power control (including the Qbico acquisition) and ClearPath autonomous mobile robots were highlighted as key drivers .
Lifecycle Services was the weak spot with -6% organic decline, though book-to-bill of 1.16x indicates backlog is building . Management attributed softness to continued CapEx project delays as customers await clarity on trade policy .
Industry Vertical Performance
Regional Performance
North America accounted for ~64% of Q1 revenue and drove the majority of growth . Management continues to emphasize the $2B domestic investment announced last year to modernize infrastructure .
What Did Management Guide?
FY26 Guidance Update
The $0.20 increase to the low-end of EPS guidance reflects an updated full-year tax rate of ~19.5% vs. prior ~20% . Guidance excludes the impact of the anticipated Sensia JV dissolution, which management expects to complete in H1 FY26 .
Industry Outlook (FY26)
Management continues to expect "sequential improvement in sales and earnings through the year" with Q1 representing the seasonal low point .
Q2 Specifics: CFO Christian Rothe guided to ~$2.85 adjusted EPS in Q2, with mid-single-digit YoY sales growth and margin expansion of less than 100 bps YoY . The sequential EPS increase includes ~$0.10 headwind from tax rate normalization (17% → 20%) .
How Did the Stock React?
Despite the beat-and-raise, ROK shares declined ~2.9% in after-hours trading to $417.86 from a close of $429.84.
The negative reaction likely reflects:
- High expectations already priced in: ROK shares have rallied significantly from the $215 low in early 2025, hitting a new 52-week high of $438.72 earlier in the day
- Lifecycle Services weakness: The -6% organic decline and continued project delays may concern investors about the broader CapEx recovery
- Modest guidance raise: Only the low-end of EPS guidance was increased by $0.20, entirely due to tax rate — no improvement in operating fundamentals vs. prior guide
Valuation context: At the after-hours price of $417.86, ROK trades at approximately 35x midpoint FY26 EPS guidance of $11.80, a premium to industrial automation peers.
What Changed From Last Quarter?
Key developments since Q4 FY25:
- Sensia dissolution on track for April 1: Will reduce revenue by ~$250M annually but add ~50 bps to company margins
- New Berlin facility announced: New manufacturing facility in southeastern Wisconsin — "Factory of the Future"
- Mequon facility purchased: Closed in Q2 for ~$60M; previously leased, now owned
- Tariff neutrality maintained: No meaningful EPS impact from tariffs in Q1, though ~30 bps drag on segment margins YoY from tariff-related costs
- Rock on Rock progress: Learnings from Singapore facility being rolled into Twinsburg plant with investments in talent and digital infrastructure
Q&A Highlights: What Analysts Asked
On Distributor Inventory & CapEx Sentiment (Scott Davis, Melius):
"Stock levels are really back to normal. The dialogue that was front and center in 2024 and into the beginning of 2025, we're done. Inventory levels around the world are back to normal levels at distribution and at the machine builders."
Blake Moret noted that while there's optimism across verticals, management needs to see "the orders as more objective proof before we would move higher on the guide."
On Q2 Outlook (Julian Mitchell, Barclays): CFO Christian Rothe provided specific Q2 targets: "We're talking about a Q2 number that's in the neighborhood of about $2.85" for adjusted EPS, reflecting ~$0.10 sequential headwind from the tax rate normalizing from ~17% to ~20%.
On Logix & Software Performance (Steve Tusa, JPM): The Software & Control strength was "pretty broad-based" — not just Logix. ASEM (open compute platforms) and FactoryTalk Optix had strong performance, while software ARR (particularly Plex) grew faster than the 7% company average.
On AI & Competition (Andrew Buscaglia, BNP): Blake Moret addressed AI differentiation:
"We're not looking to create these large, nebulous models, rather than to take LLMs and SLMs to be able to provide real value for real-world problems at customers... I don't see a huge uplift in brand-new offerings being the most significant part of the benefit to Rockwell from successfully applying this in the production environment. I see the simplification of automation and digital transformation on the plant floor being the real prize."
On Process Industries Strength (Nigel Coe, Wolfe): The 40%+ chemical growth was driven by specialty chemicals (more resilient than bulk) and competitive conversions to PlantPAx. Midstream pipeline activity and power/renewables also contributed. Management cautioned that oil prices are "fairly low" and customers are being "good stewards of their capital."
On Cost Productivity (Chris Snyder, Morgan Stanley): Productivity remains "right in the center of our plans" with strong Q1 execution. The 40% full-year incremental target is intact despite tariff-related pricing headwinds. "This organization has built a really good muscle strength around this."
Key Customer Wins This Quarter
Forward Catalysts & Risks
Catalysts:
- Sensia dissolution completion (April 1 target) — 50 bps margin tailwind, ~$250M revenue reduction
- New Berlin, Wisconsin manufacturing facility announced — "Factory of the Future" investment
- Data center expansion: AI-driven power constraints accelerating hyperscaler adoption of industrial-grade Logix controls
- L9 controller momentum and FactoryTalk Design Studio copilot adoption
- CapEx recovery in Lifecycle Services (book-to-bill of 1.16x indicates building backlog)
Risks:
- CapEx delays persist amid trade policy uncertainty — "tariffs are still jumping around"
- Semiconductor weakness: Q1 had tough comp; CapEx concentrated on AI participants only
- Life sciences project delays in North America (though pipeline expanding in GLP-1, radiopharma, med devices)
- Latin America macro deterioration (-12% organic)
EPS Walk: Q1 FY25 → Q1 FY26
The $0.90 of YoY EPS growth (+49%) was driven predominantly by volume leverage and productivity actions, partially offset by higher compensation expense .